
Website Growth
Microsoft Clarity Guide: Setup, Heatmaps and Recordings
By Bibek Thapa · Updated · 16 min read
Quick Answer
Microsoft Clarity is a free behavioral analytics tool for seeing how people use a website. Install its tracking code, confirm consent and masking, then use heatmaps, session recordings, filters and funnels to investigate specific UX or conversion questions. Pair it with GA4 or Search Console for traffic and outcome data.
Table of ContentsOn this page
- What Microsoft Clarity Does
- Microsoft Clarity Pricing and Limits
- Microsoft Clarity Guide: Setup Steps
- Configure Privacy, Consent and Masking First
- How to Read Microsoft Clarity Heatmaps
- Microsoft Clarity Guide to Session Recordings
- Use Filters, Segments and Funnels to Narrow the Problem
- Connect Clarity With GA4 and Search Console
- Microsoft Clarity Guide Workflow for SEO and CRO
- Common Microsoft Clarity Mistakes
- Microsoft Clarity vs GA4 vs Hotjar
- Microsoft Clarity Guide: A 30-Minute Review Routine
- Final Verdict
- Frequently Asked Questions
- Sources and References
Key Takeaways
- Start every Clarity review with a specific page, audience and question.
- Use heatmaps to find patterns, then recordings to inspect the context behind them.
- Treat rage clicks, scroll depth and other signals as clues, not automatic diagnoses.
- Configure consent and masking before relying on the data or sharing recordings.
- Measure the result of each change in GA4 or another outcome-tracking system.
A pageview tells you that someone arrived. Microsoft Clarity lets you look closer: where that person clicked, how far they scrolled, which path they followed and where the page became difficult to use. This Microsoft Clarity guide covers the part that matters after installation—turning those observations into website changes you can defend and measure.
Clarity is free to use, with no paid upgrade requirement. Microsoft also lists unlimited heatmaps, websites and team members on its current pricing page [1]. There is little financial risk in trying it. The analytical risk remains: A heatmap does not explain intent, and a recording does not prove that one design choice caused a conversion problem.
A useful review starts with an important page and one question. Narrow the data with filters, inspect the pattern, watch recordings that fit it, and test one sensible change. GA4, Search Console or your ecommerce platform can then show whether the outcome moved.
What Microsoft Clarity Does
Microsoft describes Clarity as a behavioral analytics tool for understanding interactions with a website or app. Its core features now include session recordings, heatmaps, event and funnel tracking, and Copilot chat or summaries [2].
That is a different job from standard traffic analytics. GA4 can show how visitors arrived, which events fired and whether a defined conversion occurred. Search Console can show the queries and landing pages that generated Google Search impressions and clicks. Clarity adds a visual layer: did visitors reach the form, click a non-interactive image, jump repeatedly between sections, or abandon a step after an error?
What Clarity is useful for
Clarity can help you investigate questions such as:
- Do mobile visitors reach the primary call to action?
- Are people clicking an image or label that looks interactive but is not?
- Where does attention fall away on a long article?
- Which step in a checkout or lead form shows the most friction?
- Do visitors from organic search behave differently from paid or referral traffic?
- What happened immediately before a JavaScript error or abandoned step?
It is less useful when the question is vague. Watching ten unrelated recordings may produce ten interesting stories and no reliable priority.
What Clarity cannot tell you by itself
Clarity does not measure Google rankings, backlinks or search demand. It also cannot establish why someone behaved a certain way without further evidence. A short visit could mean disappointment, or it could mean the visitor found the answer immediately. A dense cluster of clicks could show interest, confusion or a broken element.
Use behavior data to form a hypothesis. Validate the hypothesis with an outcome metric, a user test, customer feedback or a controlled experiment.
Microsoft Clarity Pricing and Limits
Yes. Microsoft says Clarity is free forever and that users will not be required to upgrade to a paid version [1]. The current pricing page also lists the full feature set at no cost.
“Free” does not mean “unlimited in every technical sense.” Microsoft’s FAQ says Clarity records up to 100,000 sessions per project per day and notes that recordings may not be available for every tracked session [12]. There is no paid plan or monthly traffic allowance to manage, but operational limits and data-retention rules still exist.
Cost is also not the only adoption question. Before installing any behavioral analytics tool, consider consent requirements, internal access, data masking, retention and whether the pages being recorded contain sensitive information.
Microsoft Clarity Guide: Setup Steps
Clarity supports manual installation, third-party platforms and an NPM package. For a manual setup, each project has its own tracking code, which you copy into the website’s <head> section. Supported platform integrations include WordPress, Shopify, Wix and Squarespace [3].

1. Create the project
Sign in to Clarity, create a project for the website and check that the domain is correct. Use a separate project for a separate website when you need clean reporting and access control. The same project script can cover subdomains of one website.
2. Choose one installation method
Use the method that fits the website’s existing workflow:
- Manual code: Copy the project tracking code into the site’s
<head>. - Google Tag Manager: Add Clarity through the existing container and publish the change. If your team already manages analytics tags in GTM, keeping Clarity there is easier to audit.
- WordPress: Install Microsoft’s official Clarity plugin and connect the project.
- Shopify or another supported platform: Follow the current platform-specific instructions from Microsoft rather than editing a theme from an old tutorial.
- NPM: Use the package and initialization method documented for JavaScript applications.
Install the project once. Running the same tracking code through both a plugin and a tag manager can complicate verification and troubleshooting.
If Google Tag Manager is your chosen route, Anobee’s Google Tag Manager setup guide explains the container and publishing workflow in more detail.
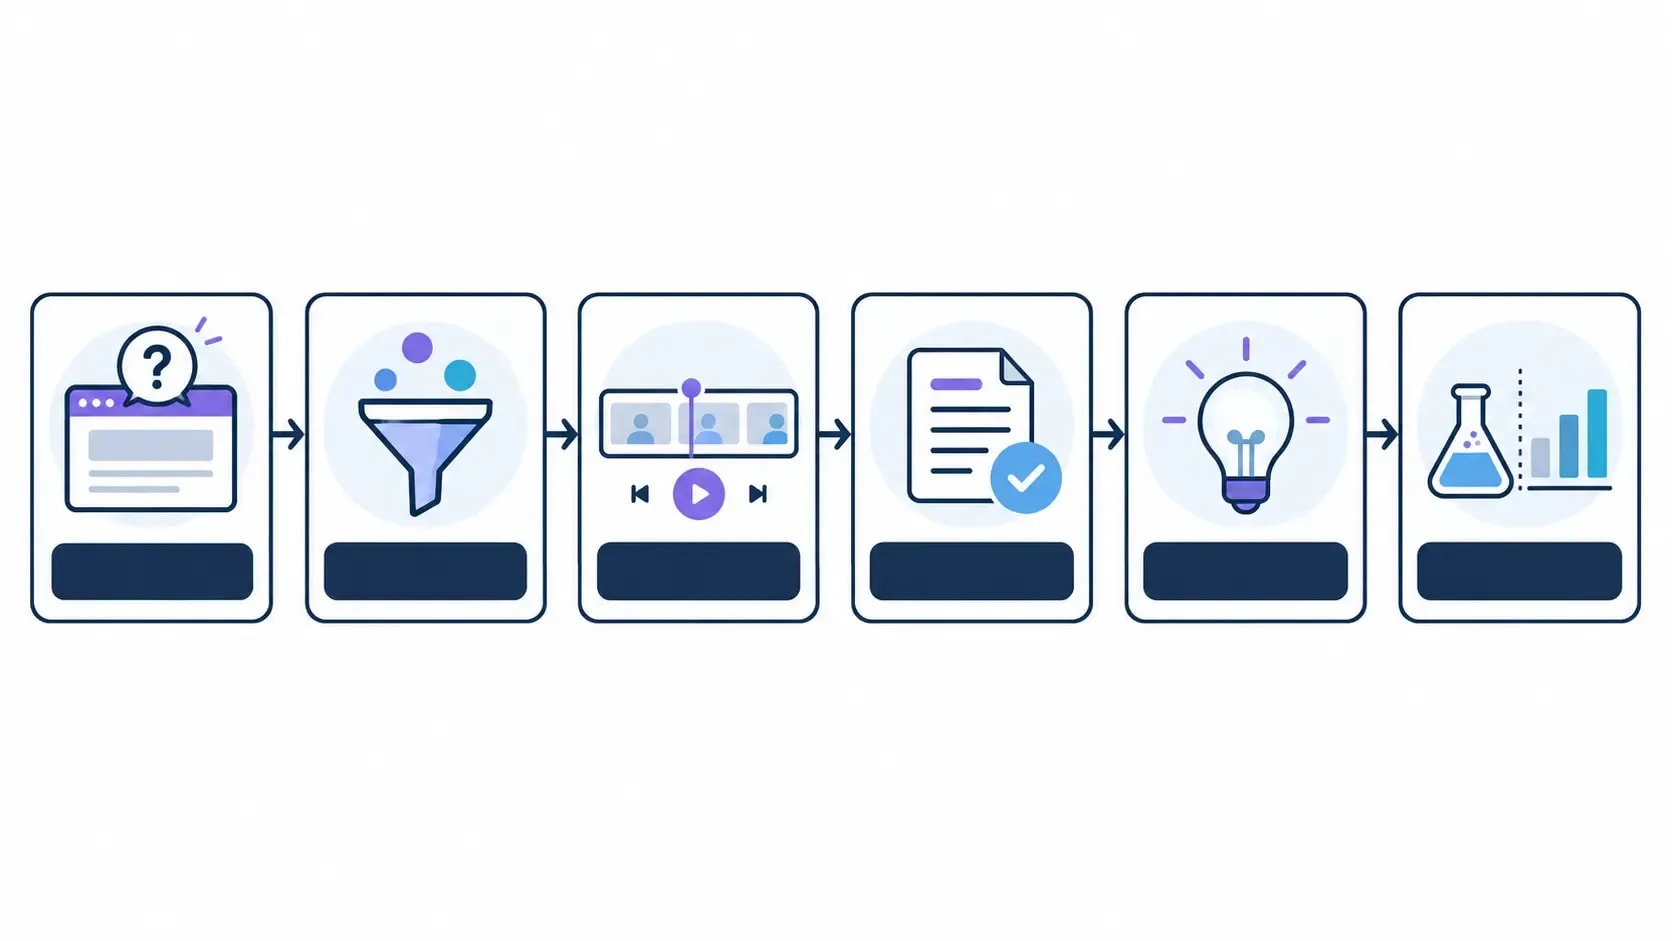
3. Verify the installation
Seeing the code in a template is not enough. Microsoft documents two direct checks: look for real-time activity in the Clarity project, or use the browser’s Network panel to confirm POST requests to clarity.ms/collect while interacting with the site [3].
Check representative page types, not only the homepage. A tag can work on a standard page while missing a checkout, subdomain, single-page application route or newly deployed template.
4. Exclude avoidable noise
Before evaluating patterns, filter or block internal traffic where appropriate. Also confirm that bot detection is enabled if that matches your reporting plan. Document exclusions so a later analyst knows why Clarity and another analytics platform may show different totals.
5. Define access and ownership
Give administrative access only to people who need to change project settings, masking or users. Team members who only review behavior data do not need every permission. Decide who owns consent checks, who reviews recordings and where approved findings will be logged.
Configure Privacy, Consent and Masking First
Behavior analytics can expose more context than a pageview count. Treat privacy configuration as part of installation, not as a later cleanup step.
Consent Mode
Since October 31, 2025, Microsoft has enforced consent-signal requirements for visits from the European Economic Area, United Kingdom and Switzerland. Clarity’s Consent Mode can prevent cookies from being set until a valid consent signal is received, and site owners remain responsible for communicating changes in consent to Clarity [4].
Your implementation may use a supported consent-management platform or Clarity’s Consent API. The correct legal basis and banner wording depend on the site, audience and jurisdiction. Clarity provides controls; it does not replace legal review.
After implementation, test both paths. Decline analytics consent and confirm that the expected cookies are not written. Then grant consent and check the resulting status. Microsoft’s documentation includes a browser-console method for reviewing the consent object [4].
Content masking
Clarity masks sensitive content by default, including all input boxes and dropdown menus. Its default Balanced mode classifies numbers and email addresses as sensitive, while Strict and Relaxed modes change how other page content is handled. Content that is masked is not uploaded to Clarity [5].
Still, review the rendered recordings yourself. Add explicit masking for account information, personal details, order data or any element that should not leave the browser. Microsoft supports CSS-selector rules and the data-clarity-mask attribute. Masking changes affect new recordings and are not retroactive [5].
Do not use Clarity on a website or app aimed at users under 18; Microsoft states that restriction in its current overview and setup documentation [2].
How to Read Microsoft Clarity Heatmaps
A heatmap aggregates interactions across page views. It is useful for finding where attention or action concentrates, but it strips away much of the sequence and intent visible in an individual session.
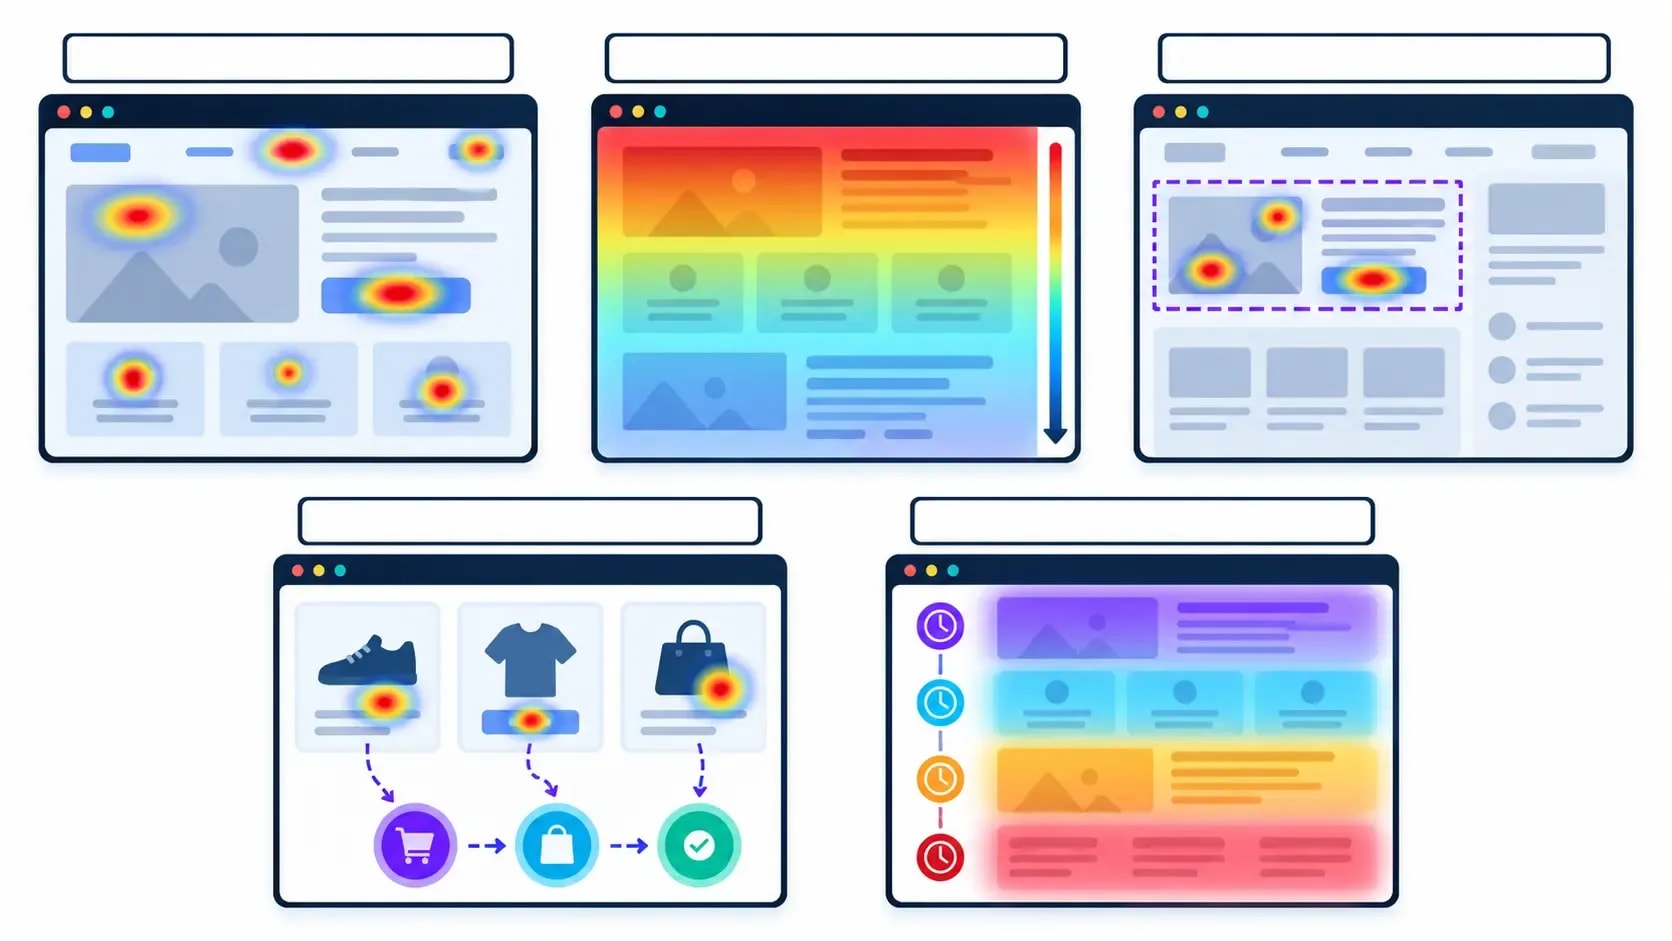
Microsoft currently documents five heatmap types: click, scroll, area, conversion and attention maps [6]. That is broader than the older three-map descriptions still found in many tutorials.
Click maps
Click maps rank page elements by clicks. Clarity includes views for all clicks, dead clicks, rage clicks, error clicks, first clicks and last clicks [6].
Look for:
- clicks on non-interactive images, labels or decorative elements;
- primary buttons that receive fewer clicks than a nearby secondary element;
- mobile navigation items that attract repeated or error clicks;
- first clicks that do not match the page’s intended path.
A high click count is not automatically good. Open relevant recordings and inspect what happened before and after the click.
Scroll maps
Scroll maps show the percentage of users who reached different parts of a page and mark an average fold [6]. They are useful for checking whether essential information appears before a large drop-off.
Someone who stops scrolling is not necessarily dissatisfied. An informational page may already have answered the question. A drop before the required action on a checkout or lead page is more concerning, so interpret the map against the page’s purpose and outcomes.
Area maps
Area maps total clicks within a selected part of the page. They help when a component contains several links or controls and you need an aggregate view of that section.
Conversion maps
For ecommerce sites, conversion maps connect clicks with purchase behavior and order value. Use them to compare elements that attract attention with elements involved in completed purchases [6]. Check that ecommerce events and product data are implemented correctly before drawing conclusions.
Attention maps
Attention maps estimate the time users spend on sections of a page [6]. They can highlight areas that hold attention, but elapsed time is not the same as comprehension. Pair the map with scroll behavior, recordings and the page’s actual goal.
A better heatmap review sequence
- Select one important page or a well-defined group of similar URLs.
- Separate desktop and mobile data.
- Apply a meaningful traffic-source, country or audience filter when relevant.
- Inspect scroll and attention patterns before zooming into individual clicks.
- Note one or two anomalies that affect the page’s main task.
- Open recordings that match those anomalies.
- Write a testable explanation, not a design command.
For example: “Mobile visitors who reached the pricing section often tapped the plan heading, perhaps expecting it to expand.” That observation leads to a focused recording review. It does not yet justify rebuilding the pricing page.
Microsoft Clarity Guide to Session Recordings
In this part of the Microsoft Clarity guide, choosing the right recordings matters more than watching many of them. Clarity recordings are visual reconstructions made from page information and user actions. They are not literal video captures of a visitor’s screen [7]. This distinction matters when a replay looks slightly different from the live page or fails to show content inside a third-party iframe or canvas.
Start from a question and filter
Choose a concrete question, such as:
- Why do mobile users abandon the contact form?
- What happens before a dead click on the product gallery?
- Do organic visitors reach the comparison table?
- Where do visitors return to the previous page?
Filter to the relevant device, page path, traffic source, behavior or event. Then watch a small, coherent set of sessions. The number required depends on traffic and variation; there is no defensible universal sample size that makes every observation reliable.
Watch for sequences, not isolated gestures
One rapid click means little on its own. Look at the sequence around it:
- Where did the visitor enter?
- What information was visible?
- Which element did the visitor try first?
- Did the interface respond?
- What happened next?
Use labels or favorites for sessions that clearly support an issue. Avoid identifying a person when a behavior label such as “mobile validation error” is enough.
Know the retention window
Standard playback data is retained for 30 days. Microsoft says labeled or favorited sessions and heatmap data are retained for nine months [11]. Save the evidence you need within those limits, and do not promise a client or teammate that every historical recording will remain available.
Use Filters, Segments and Funnels to Narrow the Problem
The fastest route to an actionable finding is usually better segmentation, not more watching.
Microsoft documents more than 30 filters spanning user information, actions, paths, traffic, performance, products, sessions, pages and custom data. Useful filters include device, browser, location, entry or exit URL, UTM source, page scroll depth, JavaScript errors, rage clicks, dead clicks, quick backs, smart events and funnels [8].
Filters worth saving as segments
- Mobile visitors who entered on a key organic landing page.
- Paid-campaign visitors who reached a form but did not complete it.
- Sessions with a JavaScript error after a click.
- Ecommerce visitors who viewed a product and started checkout.
- Returning readers who reached the primary email signup.
Name saved segments so another person can understand them. Include the page, audience and behavior instead of names such as “Segment 4.”
Funnels are now built in
Clarity supports code-free funnels made from page visits and smart events. A funnel can report conversion rate, converted sessions and median time to convert, with links into filtered heatmaps or recordings for each stage [9].
This corrects an important limitation in older Clarity comparisons. You no longer need a separate paid tool merely to define a basic funnel. You may still prefer GA4 or a product-analytics platform for attribution, richer event analysis or governance, but “Clarity has no funnels” is outdated.
Connect Clarity With GA4 and Search Console
Clarity and GA4 should answer different parts of the same investigation.
| Question | Best starting point |
|---|---|
| Which search queries generated Google impressions and clicks? | Search Console |
| Which channels and campaigns sent sessions? | GA4 |
| Which events or conversions occurred? | GA4 or an ecommerce platform |
| Where did visitors click or stop scrolling? | Clarity heatmaps |
| What sequence preceded visible friction? | Clarity recordings |
| Did a page change improve outcomes? | GA4, experiment data or business records |
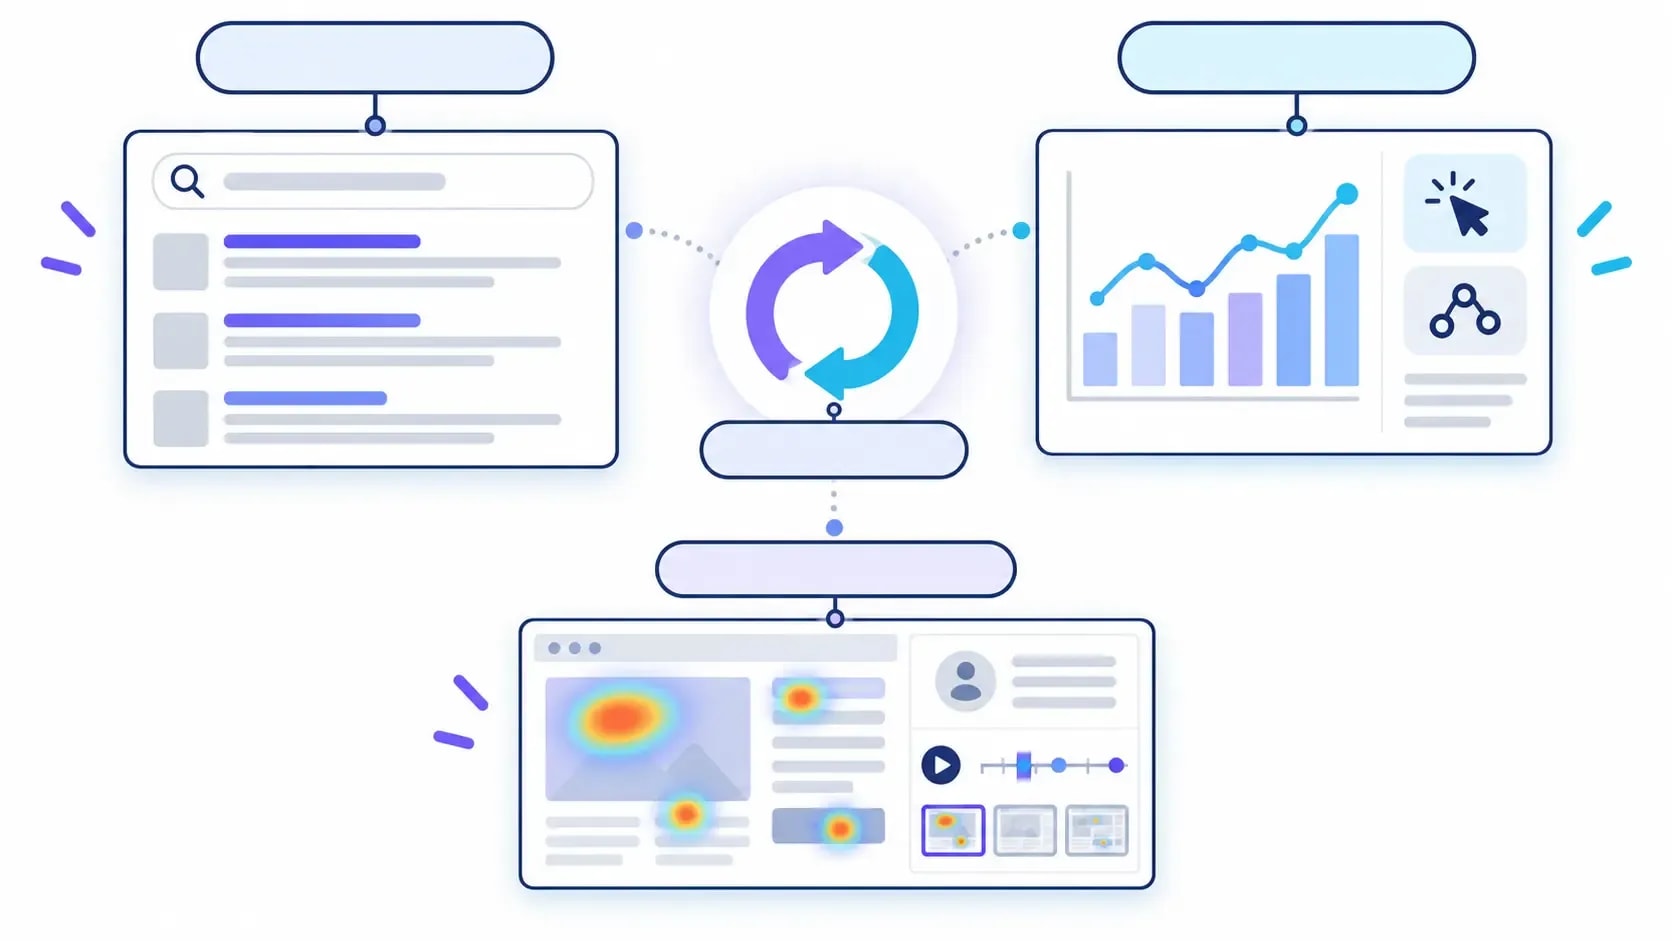
Microsoft’s GA integration allows Clarity to pull Google Analytics data into the Clarity experience. One GA web property can currently be connected to each Clarity project [10]. Anobee’s Google Analytics setup guide covers the GA4 side of the setup.
For SEO work, begin with Search Console. Find a landing page with meaningful impressions or clicks and a business reason to improve. Then use GA4 to understand engagement or conversions, and Clarity to inspect page behavior. A Clarity signal is not evidence of a Google ranking factor. Its value is more practical: it helps you improve the experience of people who already arrive.
Microsoft Clarity Guide Workflow for SEO and CRO
1. Choose the page by impact
Start with a page that has traffic, a clear task and a measurable outcome. Good candidates include high-traffic articles, product pages, landing pages, signup pages and checkout steps.
2. Write one investigation question
“Review the homepage” is too broad. “Why do mobile organic visitors leave before reaching the service comparison?” defines a page, audience and behavior.
3. Record a baseline
Before making changes, record the date, selected filters, relevant page metrics and business outcome. Save the heatmap or session links your team is permitted to retain. Without a baseline, later movement is hard to interpret.
4. Triangulate the evidence
Look for the same problem in at least two forms of evidence. A click map may reveal dead clicks on a product image, while recordings show repeated taps followed by abandonment. Customer messages may confirm that people expect a zoom feature.
Agreement does not prove causation, but it creates a stronger hypothesis than one unusual replay.
5. Make the smallest useful change
Fix a broken element directly. For uncertain design choices, change one meaningful variable or run an experiment. Avoid redesigning an entire page from one heatmap.
6. Measure the outcome
Check the metric connected to the original question: form completion, checkout progression, internal-link clicks, qualified leads or another useful outcome. A reduction in rage clicks is helpful only if the page also works better for users and the business.
If conversion work is the main goal, the conversion rate optimization guide explains how to move from observation to hypothesis, test and decision.
Common Microsoft Clarity Mistakes
Watching random recordings
Random viewing overweights memorable behavior. Filter from an important question so each recording belongs to the same investigation.
Treating a heatmap as a verdict
Heatmaps aggregate behavior and remove context. Use them to locate a pattern, then inspect recordings and outcomes.
Mixing device experiences
Desktop and mobile layouts can produce different paths, folds and interaction problems. Review them separately before proposing a shared fix.
Claiming Clarity explains “why” automatically
A recording shows a sequence. Your explanation of that sequence is still an inference unless user feedback or a controlled test confirms it.
Ignoring consent and masking
Default protections are useful, but the publisher remains responsible for the implementation. Test masking on the actual sensitive templates and verify the consent state.
Using old feature comparisons
Clarity changes. Current documentation includes funnels, five heatmap types and AI-assisted features that older reviews may omit. Recheck official sources before comparing products or publishing screenshots.
Making large changes without a baseline
If several page elements change at once and no baseline was recorded, you may know that performance moved but not which change mattered.
Microsoft Clarity vs GA4 vs Hotjar
Use Clarity when you need free heatmaps, recordings, filters and behavior-oriented funnels. Use GA4 when you need acquisition reporting, event measurement and broader conversion analysis. Use both when you need to connect page behavior with traffic and outcomes.
Hotjar overlaps more directly with Clarity because both products offer behavior analytics. The right choice depends on current pricing, recording limits, feedback tools, integrations, governance and the depth of research features you need. Those details change often, so use Anobee’s current Microsoft Clarity vs Hotjar comparison instead of relying on an old feature table here.
Microsoft Clarity Guide: A 30-Minute Review Routine
Daily dashboard browsing is rarely necessary. A focused review can fit into a short recurring session:
- Five minutes: Check the one page and outcome chosen for the review.
- Five minutes: Open mobile and desktop heatmaps with the relevant segment.
- Ten minutes: Watch recordings tied to the strongest anomaly.
- Five minutes: Write the observation, evidence and proposed explanation.
- Five minutes: Assign one action, owner, measurement and review date.

Keep an evidence log with columns for the page, segment, observation, recording or heatmap link, hypothesis, change, baseline, outcome and decision. This turns Clarity from an interesting replay tool into part of a repeatable improvement process.
Final Verdict
Microsoft Clarity is worth using when your team has a real question about page behavior and a way to measure what happens after a change. Its price removes a common barrier, and its current feature set covers far more than basic click and scroll maps.
Interpretation is where the work begins. A disciplined review separates observation from explanation, protects visitor data, and connects each change to a result. Use this Microsoft Clarity guide as a starting point: install the tool correctly, choose one high-value page, and let evidence—not the most dramatic recording—set the priority.
Frequently Asked Questions
Is Microsoft Clarity really free?
Yes. Microsoft describes Clarity as free forever, with no paid upgrade requirement. Operational limits still apply: its FAQ says it can record up to 100,000 sessions per project per day.
How long does Microsoft Clarity keep recordings?
Playback data is retained for 30 days. Labeled or favorited sessions and heatmap data are retained for nine months, according to Microsoft's current retention documentation.
Does Microsoft Clarity replace Google Analytics 4?
No. Clarity is strongest for observing behavior on pages. GA4 is better suited to traffic acquisition, events, attribution and outcome measurement. Connecting them gives you more useful context.
Is Microsoft Clarity GDPR compliant?
Clarity provides consent and masking controls, but installing it does not make a website compliant automatically. The site owner remains responsible for obtaining any required consent, configuring the tool and meeting applicable law.
What should I analyze first in Microsoft Clarity?
Start with a high-value page that already has enough traffic and one clear question, such as why mobile visitors abandon a form. Filter to that page and device, inspect the heatmap, then review relevant recordings.
Sources and References
- Pricing - Microsoft Clarity ↩
- Clarity overview - Microsoft Learn ↩
- Set up Clarity - Microsoft Learn ↩
- Consent Mode - Microsoft Learn ↩
- Masking content - Microsoft Learn ↩
- Heatmaps overview - Microsoft Learn ↩
- Recordings overview - Microsoft Learn ↩
- Filters overview - Microsoft Learn ↩
- Funnels - Microsoft Learn ↩
- Google Analytics integration - Microsoft Learn ↩
- Data retention - Microsoft Learn ↩
- Frequently asked questions - Microsoft Learn ↩
Was this guide helpful?
Your answer helps Anobee improve future updates.

Written by
Bibek Thapa
AI-Powered Digital Growth Strategist
Bibek Thapa works across AI workflows, SEO, AI search optimization, content strategy, website growth, and productivity systems. Anobee documents practical lessons, tools, experiments, and systems for improving digital presence.
- AI workflows
- Digital growth
- SEO
- GEO
- AEO
- Content strategy
- Website growth


